
Quick answer:
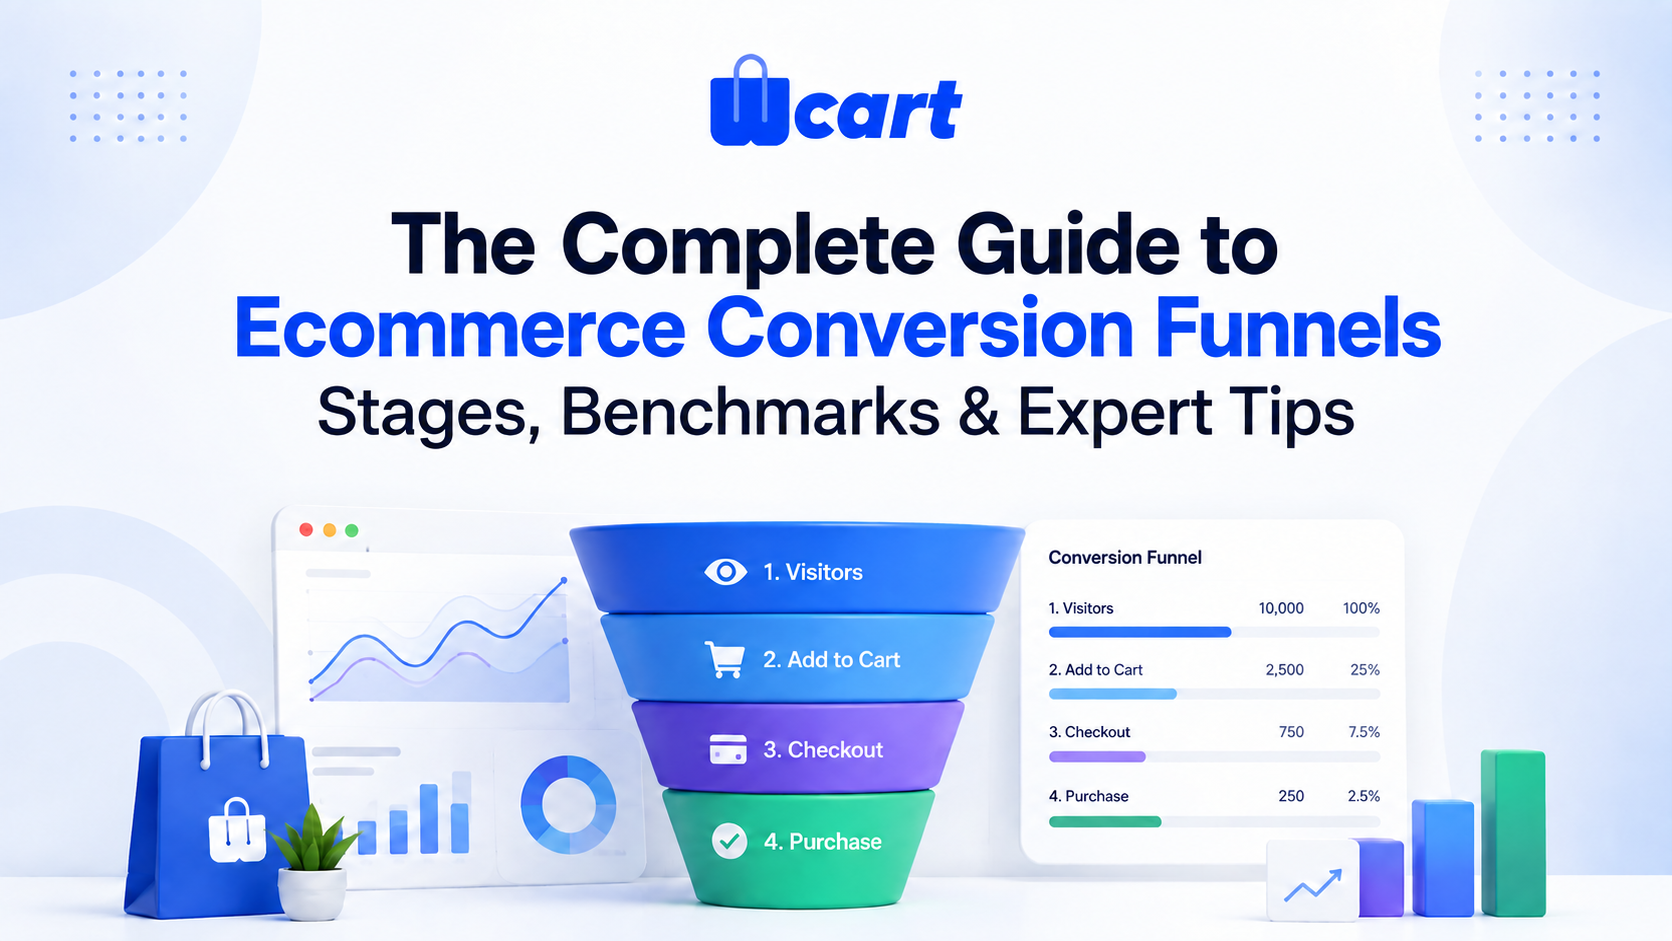
An ecommerce conversion funnel is the path a shopper takes from first landing page visit on your store to completing a purchase, typically session, product view, add-to-cart, checkout, and purchase. Each stage converts only a fraction of the people who reached the one before it. Understanding these layers, and where shoppers actually drop off between them, is how you find and fix the specific problem costing you revenue.
By the Wcart team, we build and support white-label ecommerce and multi-vendor marketplace software, so this is written from hands-on platform experience.
Key Takeaways
- The average ecommerce conversion rate sits between 2% and 3% globally. Top-performing stores reach 5% or higher. (Source: Triple Whale, Ecommerce Benchmarks 2026)
- The typical add-to-cart rate runs roughly 6% to 7.5%. Anything below 5% usually signals a product page problem, not a traffic problem. (Source: MIDA, 2026 Conversion Funnel Benchmarks)
- Cart abandonment holds around 70% across ecommerce overall, one of the most consistently cited numbers in the industry. (Source: research compiled by the Baymard Institute, via Kirro’s funnel benchmark roundup)
- Checkout completion rates commonly land between 20% and 40%. Well-optimized checkouts reach 45% to 55%. (Source: Chatboq, Ecommerce Funnel Benchmarks 2026)
- Mobile conversion rates (around 2.8%) consistently trail desktop (around 3%). Checkout friction on smaller screens is the main driver. (Source: MIDA, 2026 Conversion Funnel Benchmarks)
Most merchants think about their store as one number: overall conversion rate. That number hides more than it reveals.
A shopper doesn’t convert in one step. They move through a series of layers, and at every layer, some percentage of people fall away. Understanding those layers individually, not just the final blended rate, is the entire point of thinking in terms of a funnel.
This guide walks through what the ecommerce conversion funnel actually is, breaks down each layer in detail, covers real benchmarks for each one, explains the common hurdles that stall shoppers at each stage, and shows how to track and report on it so the numbers actually drive decisions.
What an ecommerce conversion funnel actually measures
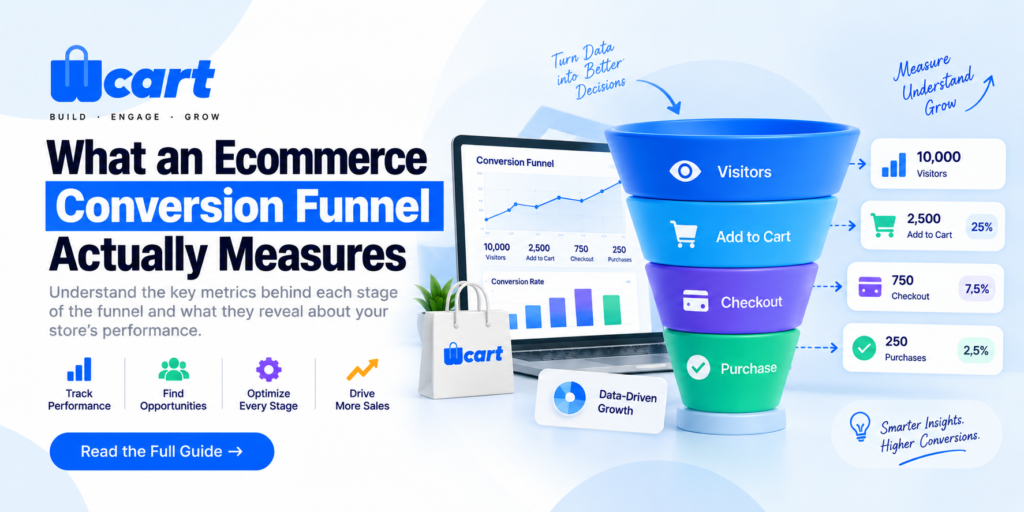
A funnel is just an ordered sequence of stages, each one a subset of the stage before it. For a typical online store the canonical five stages are:
- Sessions / visits: someone arrives on the site.
- Product views: they look at at least one product detail page.
- Add to cart: they add an item.
- Checkout started: they reach the first checkout step.
- Purchase completed: the order is paid and confirmed.
Picture it as a physical funnel. Wide at the top, where everyone enters. Narrow at the bottom, where only buyers exit. Every layer in between loses some people, and that loss is normal. No store converts 100% of visitors into buyers.
What matters isn’t the shape of the funnel in general. It’s exactly where yours narrows the fastest, and whether that narrowing is fixable.
Overall conversion rate, purchases divided by sessions, is just one summary number pulled from the bottom and top of this funnel. It’s the number that gets quoted in board meetings. But it tells you nothing about which layer is actually the problem.
The Step-by-Step Conversion Funnel Layers
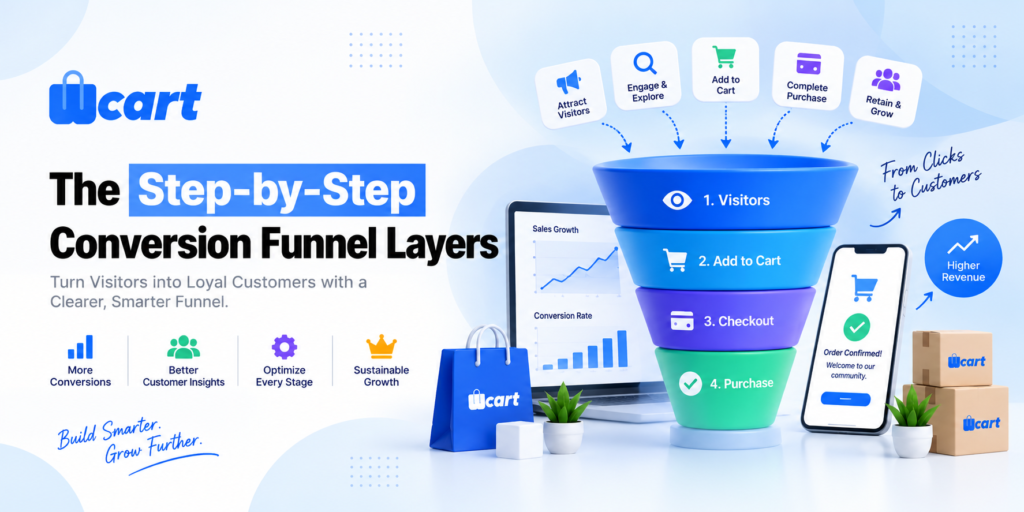
This is the core of understanding your funnel: walking through each layer individually, in order, and knowing what a weak number at that specific layer usually means.
Layer 1: Session to Product View
- Some fraction of everyone who lands on your site goes on to actually look at a specific product.
- A weak rate here usually points to your landing pages, site navigation, or on-site search. If people arrive and can’t quickly find something worth looking at, they leave before the funnel even really starts.
Common causes: confusing category structure, a homepage with no clear path to product, slow page load on entry, or paid traffic landing on a mismatched page.
Layer 2: Product View to Add-to-Cart
- Some fraction of people who viewed a product decide they want it enough to add it.
- This layer reflects product page quality directly. Pricing clarity, image quality, descriptions, reviews, and whether the value is obvious all live here.
Common causes: unclear pricing, poor or too few images, missing reviews, no obvious size or variant guidance, or a product that simply doesn’t match what the traffic source promised.
Layer 3: Add-to-Cart to Checkout Started
- Some fraction of people holding something in a cart commit to actually paying.
- This is where price shock tends to show up first. A shopper adds an item expecting one number, then sees shipping, taxes, or fees push the total higher than expected.
Common causes: shipping costs revealed too late, no visible total until checkout, or general hesitation before committing.
Layer 4: Checkout Started to Purchase Completed
- Some fraction of checkout starters actually finish.
- This is the narrowest, highest-friction layer, and also the most directly fixable one. Form length, available payment options, and page load speed all live here.
Common causes: long or confusing forms, forced account creation, too few payment methods, slow checkout pages, or a lack of trust signals right before payment.
Why this order matters: each layer should be read on its own, not averaged into the others. A store with a strong add-to-cart rate but a weak checkout completion rate has a completely different problem, and needs a completely different fix, than a store with the reverse pattern.
Treating the funnel as four separate diagnostic checkpoints, rather than one blended number, is what actually leads to a fix instead of a guess.
Ecommerce Conversion Funnel Benchmarks by Layer
Benchmark numbers vary between reports. They come from different samples, industries, and definitions of each layer. Use the ranges below as a general sense of where stores commonly land, not a target to hit exactly.
| Funnel Layer | Typical Range Reported | Source |
| Overall session-to-purchase | 2% to 3%, top performers above 5% | Triple Whale |
| Product view to add-to-cart | 5% to 10%, commonly cited around 6% to 7.5% | MIDA |
| Add-to-cart to checkout started | 20% to 40% | Chatboq |
| Checkout started to purchase completed | 20% to 40% typical, 45% to 55% for optimized checkouts | Chatboq |
| Cart abandonment (inverse of the last two layers combined) | Near 70% | Baymard Institute, via Kirro |
Cart abandonment is one of the more consistently cited numbers in ecommerce research, commonly traced back to studies compiled by the Baymard Institute. The add-to-cart and checkout-completion ranges are less standardized across sources. Use them to sanity-check your own numbers, not as a strict pass or fail line.
Key Ecommerce Funnel Metrics to Track at Each Layer
Benchmarks tell you what’s typical. Metrics tell you what’s actually happening in your own store. These are the numbers worth pulling for every layer of the funnel.
- Bounce rate. The share of sessions where someone leaves without any real interaction. A high bounce rate on landing pages points to a mismatch between what an ad or search result promised and what the page delivers.
- Product view rate. Product views divided by sessions. This is Layer 1 of the funnel expressed as a metric. A low rate usually means navigation or on-site search isn’t getting people to a product fast enough.
- Add-to-cart rate. Add-to-carts divided by product views. This is Layer 2. It’s one of the clearest signals of product page quality: pricing, images, and reviews all show up here.
- Cart-to-checkout rate. Checkout starts divided by add-to-carts. This is Layer 3, and it’s where price shock from shipping or taxes typically first appears.
- Checkout completion rate. Purchases divided by checkout starts. This is Layer 4, the narrowest and most fixable part of the funnel. Form length and payment options live here.
- Cart abandonment rate. The inverse of add-to-cart-to-purchase as a whole: the share of carts that never turn into an order. This is the summary number most often quoted in industry reports, but it always traces back to a specific layer above, so use it as a headline, not a diagnosis.
- Average order value (AOV). Total revenue divided by number of orders. AOV doesn’t measure where people drop off, but it tells you how much each fix at the bottom of the funnel is actually worth.
- Exit rate by page. The share of sessions that end on a specific page, as opposed to bounce rate, which only counts sessions that end on the very first page visited.
For a fuller breakdown of metrics beyond the funnel itself, like retention and repeat purchase rate, see our guide on ecommerce metrics that actually drive growth.
Common Hurdles to Conversion at Each Layer
These are the recurring problems that show up once you look at each funnel layer individually instead of one blended rate.
- Shipping and tax costs revealed too late – Shoppers add something to cart expecting one price, then see a higher total at checkout. Showing an estimated total earlier in the flow fixes this directly.
- Forced account creation – Requiring a login before checkout adds friction at the exact moment intent is highest. Guest checkout removes the hurdle without removing the option to create an account later. See our guest checkout vs. account creation guide for the trade-offs.
- Too few payment options – Shoppers who don’t see their preferred method, a specific card network, a digital wallet, buy-now-pay-later, often abandon rather than switch.
- Slow page loads at checkout- Every extra second at the final layer is a chance for the shopper to reconsider or get distracted.
- A checkout form that asks for too much – Every extra field is a small tax on completion. Fewer required fields and address autofill consistently help. Our checkout optimization guide covers this in more depth.
- No trust signals near payment – Security badges, a visible returns policy, and real customer reviews reduce last-minute hesitation.
How to Track and Report on Your Funnel
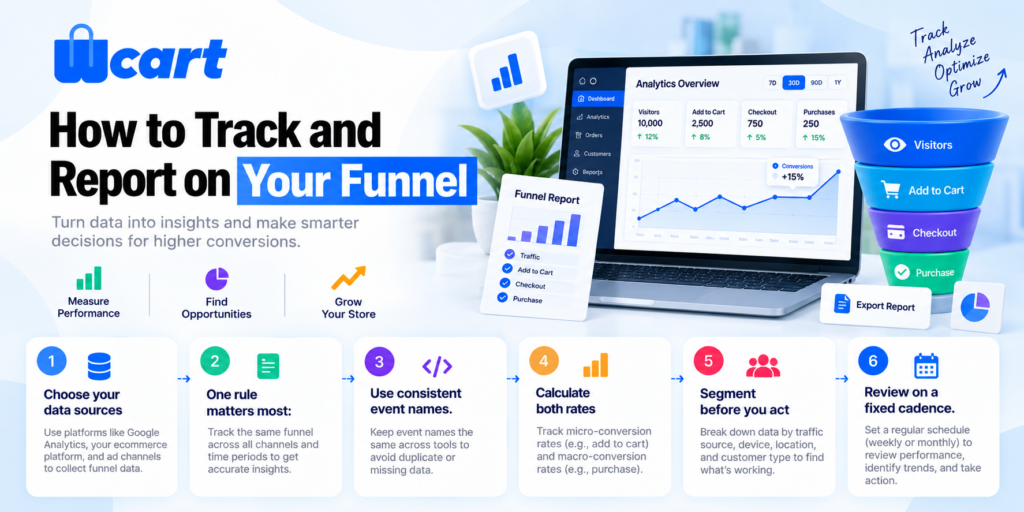
Knowing the layers is only useful if you can actually see where your own store loses people. That’s what tracking and reporting are for.
1.Choose your data sources
Blend three sources rather than relying on one:
| Source | Best For | Watch Out For |
| Analytics events (GA4, etc.) | Top-of-funnel: sessions, page and product views, add-to-cart | Cookie consent gaps, ad-blockers, and sampling that undercounts real traffic |
| Platform or order database | Bottom-of-funnel: checkout starts, paid orders, the source of truth for revenue | Needs engineering access; schema varies by platform |
| Payment processor (Stripe, etc.) | Confirmed payments, failed-payment reasons, refunds | Only sees the payment layer, not earlier browsing |
2. One rule matters most:
your purchase count should come from your order or payment system, never a client-side analytics tag. Browser-side tracking undercounts because of ad-blockers, consent banners, and tags that fire after the shopper navigates away.
3. Use consistent event names.
Standard ecommerce event names (view_item, add_to_cart, begin_checkout, purchase) let your tools speak the same language. Make sure every event carries one consistent session or customer identifier, so the layers genuinely nest inside each other instead of being disconnected counts.
4. Calculate both rates
For each layer, track the step conversion rate (this layer’s count divided by the previous layer’s count) and the overall rate (this layer’s count divided by total sessions). Also record the absolute number of people lost at each layer. A small percentage drop on a large layer can mean more lost revenue than a big percentage drop on a small one.
5. Segment before you act
A blended funnel hides real opportunities. Device (mobile usually converts lower than desktop), traffic source, and new versus returning shoppers are the three segments most worth checking first.
6. Review on a fixed cadence.
Weekly for active stores, monthly for slower catalogs. Each review, find the single biggest leak, form a hypothesis, ship one change, and check the next report to see if the step rate moved.
For a deeper, dedicated walkthrough of building the report itself, with a full worked example, see our guide on ecommerce metrics that actually drive growth. For the specific problem of carts that never convert, see abandoned cart recovery and reducing checkout abandonment at the payment step.
Common mistakes that make funnel reports lie
- Counting purchases from the browser tag. Use settled orders from your platform or processor as truth.
- Unstitched stages. If the steps aren’t joined on one identity key, the “subset” relationship is fiction.
- Ignoring consent and ad-blocker loss. Top-of-funnel counts are systematically under-reported; know your blind spot.
- Blending segments. The average funnel rarely reflects any real user’s experience.
- Chasing the headline rate. Optimize step rates and absolute drop-off, not the vanity number.
- Confusing micro-conversions with revenue. A higher add-to-cart rate that doesn’t lift purchases is motion, not progress.
If you want a tightly integrated funnel out of the box, where storefront, cart, checkout, and order data already share one identity layer, that’s the kind of thing a unified platform like Wcart is built to give you, instead of stitching five tools together by hand.
Frequently asked questions
What is an ecommerce conversion funnel?
It’s the path a shopper takes from first landing on your store to completing a purchase, broken into layers: session, product view, add-to-cart, checkout, and purchase. Each layer converts only a portion of the people who reached the one before it, and tracking each layer separately is how you find exactly where you’re losing shoppers.
What is a good ecommerce conversion rate?
There’s no single universal number. Reports commonly cite an overall range around 2% to 3%, with top performers reaching 5% or higher. Rather than chasing an external benchmark, track your own layer-by-layer rates over time and focus on the layer where you lose the most people.
How many stages should my funnel have?
Start with five, sessions, product views, add-to-cart, checkout started, and purchase. Only add stages you can measure reliably and that would change a decision, such as “search performed” for search-heavy stores or “vendor storefront viewed” for marketplaces. Extra stages you can’t instrument cleanly just add noise.
Should I use Google Analytics or my store database for the funnel?
Use both. Analytics is best for top-of-funnel browsing events like sessions and product views, while your order or payment system is the source of truth for checkout starts and completed purchases. Never count final purchases from a client-side analytics tag, because ad-blockers and consent banners cause it to undercount.
Why does my analytics conversion rate differ from my actual orders?
Client-side tracking commonly under-reports purchases due to ad-blockers, cookie consent choices, page navigation firing before the tag, and sampling. Your true order count comes from your backend or payment processor. Expect a gap and reconcile the two rather than trusting the browser-side number for revenue decisions.
What is a checkout conversion funnel, specifically?
It’s the narrower slice of the full funnel covering checkout started through purchase completed, the point where a shopper has already committed to buying and is deciding whether to finish. It’s usually the highest-friction, most fixable layer.
Why does my analytics conversion rate differ from my actual orders?
Client-side tracking under-reports purchases due to ad-blockers, cookie consent choices, and page navigation firing before the tag. Your true order count comes from your backend or payment processor. Expect a gap and reconcile the two.
What’s the difference between micro-conversions and the main conversion?
Micro-conversions are intermediate actions like add-to-cart or newsletter signup, while the main conversion is a completed, paid purchase. Micro-conversions are useful diagnostics, but improving one only matters if it ultimately lifts paid orders. Always verify that a micro-conversion gain flows through to revenue.

























Leave a Reply