
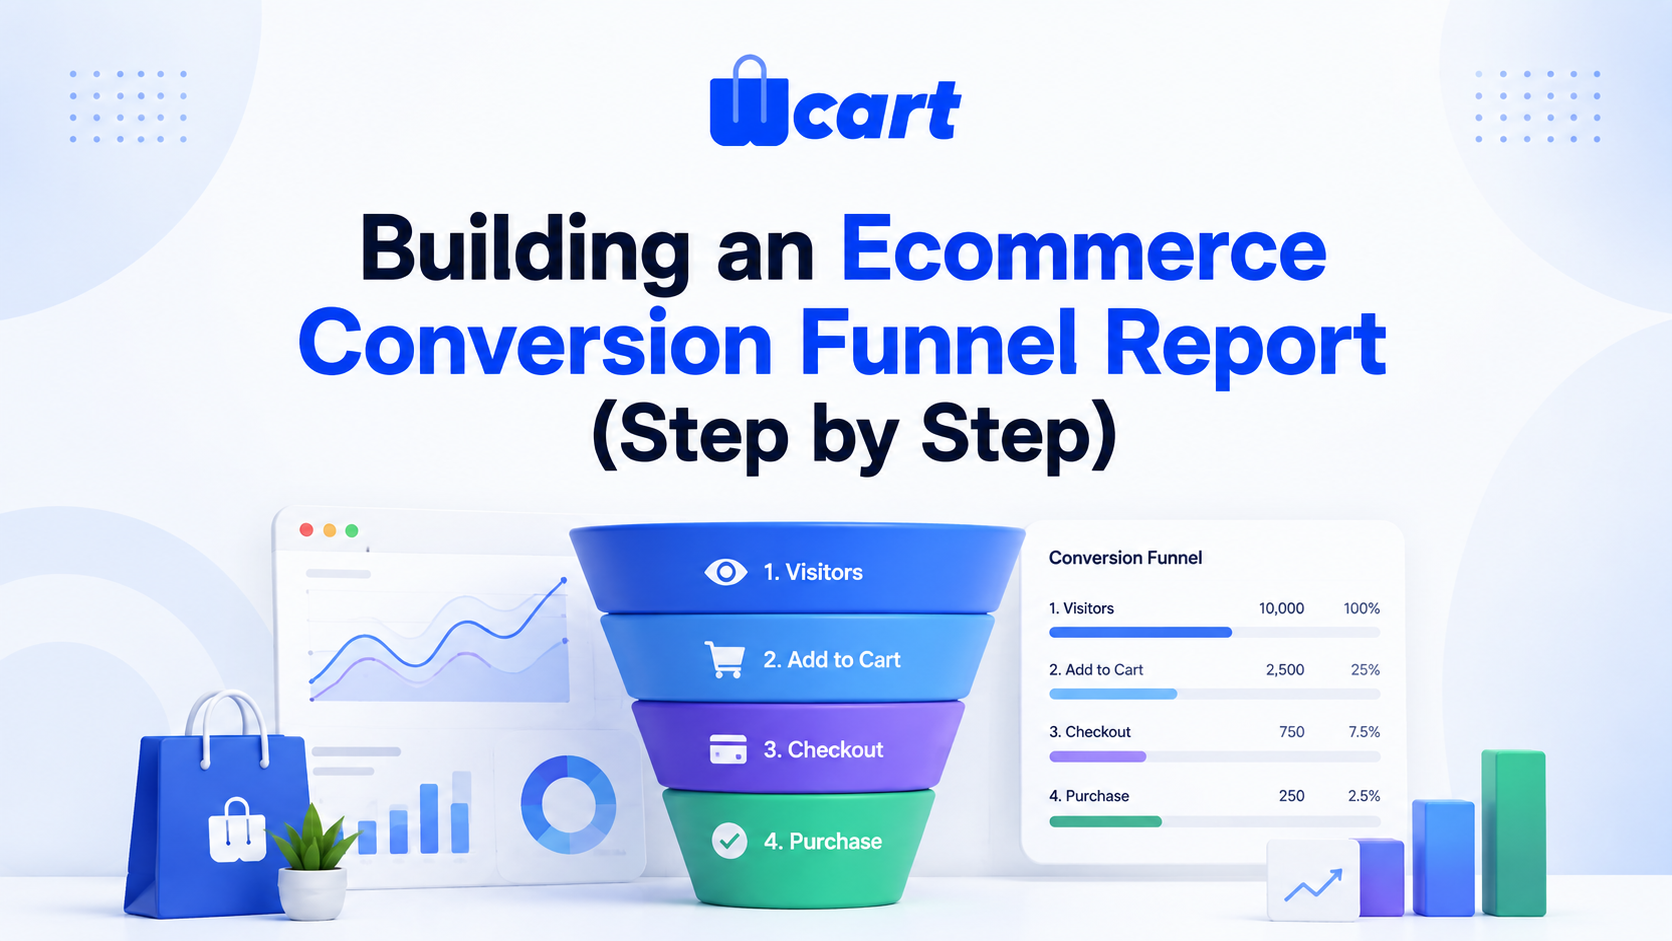
Quick answer: An ecommerce conversion funnel report tracks how visitors move through your store’s key stages (typically session start, product view, add-to-cart, checkout initiation, and completed purchase) and shows where shoppers drop off. To build one, define the stages that match your real purchase path, instrument each step with analytics events or pull them from your platform’s order and session data, calculate stage-to-stage conversion rates, segment by device and traffic source, and review the report on a fixed cadence to find the single biggest leak. The goal isn’t a pretty chart. It’s a prioritized list of where revenue is escaping and what to fix first.
By the Wcart team, we build and support white-label ecommerce and multi-vendor marketplace software, so this is written from hands-on platform experience.
Most merchants already have the raw numbers buried somewhere: in Google Analytics, in their order database, in a Stripe dashboard. What they lack is a single view that connects those numbers into a story. “100 people landed, 40 viewed a product, 12 added to cart, 5 started checkout, 2 bought.” That story is the funnel report. This guide walks through building one step by step, the way we set them up for store operators, including the data sources, the math, the segmentation that actually matters, and the mistakes that make funnel reports lie to you.
What an ecommerce conversion funnel actually measures
A funnel is just an ordered sequence of stages, each one a subset of the stage before it. For a typical online store the canonical five stages are:
- Sessions / visits: someone arrives on the site.
- Product views: they look at at least one product detail page.
- Add to cart: they add an item.
- Checkout started: they reach the first checkout step.
- Purchase completed: the order is paid and confirmed.
The number that gets quoted in board meetings, overall conversion rate, is just purchases divided by sessions. Across the industry that figure commonly sits in a low single-digit percentage range, but the exact “good” number depends heavily on your vertical, price point, traffic mix, and whether you count sessions or unique users. Treat any universal benchmark with suspicion. Your own trend over time is far more useful than someone else’s average.
Why stage-to-stage rates beat the headline number
A single overall conversion rate hides where the problem is. If your store converts at 1.8% and last quarter it was 2.2%, that tells you something broke, but not what. Stage-to-stage rates (product-view-to-cart, cart-to-checkout, checkout-to-purchase) localize the leak. A drop concentrated at checkout-to-purchase points at payment friction, unexpected shipping costs, or a broken form. A drop at product-view-to-cart points at pricing, merchandising, or stock issues. Always compute and watch the step rates, not just the end-to-end number.
Step 1: Define stages that match your real purchase path
The five-stage model is a starting template, not gospel. Map your actual store. A multi-vendor marketplace might add a “vendor storefront viewed” stage. A subscription box might split “plan selected” from “checkout started.” A store with heavy search usage might add “search performed.” The rule: only add a stage if you can instrument it reliably and if it changes a decision. Every extra stage you can’t measure cleanly adds noise.
Write the stages down as an explicit ordered list before you touch any tool. This is the contract your report is built against, and it forces you to decide edge cases up front. For example, does “add to cart” count if the item is later removed, and does a guest cart count the same as a logged-in cart?
Step 2: Choose and connect your data sources
You have three broad options, and most mature reports blend them.
| Source | Best for | Watch out for |
|---|---|---|
| Analytics events (GA4, etc.) | Top-of-funnel: sessions, page/product views, add-to-cart | Cookie consent gaps, ad-blockers, and sampling undercount real traffic |
| Platform / order database | Bottom-of-funnel: checkout starts, paid orders, the source of truth for revenue | Needs engineering access; schema varies by platform |
| Payment processor (Stripe, etc.) | Confirmed payments, failed-payment reasons, refunds | Only sees the payment step, not earlier browsing |
The single most important principle: your purchase count should come from your order/payment system, never from a client-side analytics tag. Browser-side conversion tracking routinely undercounts because of ad-blockers, consent banners, and tags that fire after the user navigates away. When the headline conversion number feeds a finance conversation, anchor it to orders that actually settled. What actually happens otherwise is predictable: marketing reports one number, finance reports another, and the next hour of the meeting gets spent arguing about which spreadsheet is wrong instead of fixing the funnel.
For the top of the funnel, Google’s own documentation on the GA4 data model and event collection is the canonical reference for how sessions and ecommerce events are defined and where they can drift. See Google Analytics developer documentation. For the underlying performance signals that affect drop-off (load time, layout shift), the guidance at web.dev is a solid, vendor-neutral source.
Step 3: Instrument the events
For each stage you need a reliable event with a consistent identifier so you can tie the steps together. At minimum capture an event name, a timestamp, a session or user identifier, and, for cart and purchase events, the item IDs and values. Standard ecommerce event names (view_item, add_to_cart, begin_checkout, purchase) exist precisely so reports and tools speak the same language. Use them rather than inventing your own.
Tie events to a single identity where you can
The hardest part of an honest funnel is making sure the “12 who added to cart” are a genuine subset of the “40 who viewed a product.” If your view events are keyed on anonymous session IDs and your purchase events are keyed on customer account IDs, the math silently breaks. Decide on one stitching key, usually a session or client ID that persists across the visit, and make sure every stage carries it. On platforms we run, we standardize this at the storefront layer so the stages are joinable by design.
Step 4: Calculate the conversion rates
Once you have counts per stage, the math is simple but easy to get subtly wrong. Compute two things for every stage:
- Step conversion rate = stage count ÷ previous stage count. (Of those who viewed a product, what fraction added to cart?)
- Overall conversion rate = stage count ÷ first stage count. (Of all sessions, what fraction reached this stage?)
Also record the absolute drop-off, the raw number of people lost at each step, because a small percentage drop on a huge stage can represent more lost revenue than a large percentage drop on a tiny one. Always look at percentage and absolute count side by side.
A worked example
Suppose a week’s data looks like this: 20,000 sessions, then 8,000 product views, then 2,400 add-to-cart, then 1,000 checkout started, then 520 purchases. The step rates are 40%, 30%, 41.7%, and 52%. The biggest percentage leak is product-view-to-cart (30%), but the biggest absolute loss is sessions-to-product-view, where 12,000 people never saw a product. Which to fix first depends on effort and value, but the report has now told you exactly where to look instead of leaving you guessing.
Step 5: Segment, because the average lies
A blended funnel hides the real opportunities. The segments that most consistently reveal something actionable:
- Device: mobile almost always converts lower than desktop. If your mobile checkout step rate is far worse, that is a concrete fix list (form length, autofill, wallet payments).
- Traffic source / channel: paid, organic, email, and direct visitors behave very differently. High-intent email traffic converting poorly is a different problem than cold paid traffic converting poorly.
- New vs. returning: returning shoppers compress the funnel, so mixing them with first-timers masks both.
- Geography / currency: for marketplaces and cross-border stores, payment method availability and shipping cost shifts move the checkout step rate sharply.
Practical advice: start with device and channel. Those two alone usually surface the highest-ROI fix in the first review.
Step 6: Build the report layout
Keep the report ruthlessly simple. A good funnel report fits on one screen and answers three questions at a glance: where is the biggest leak, is it getting better or worse, and which segment is responsible. A workable structure:
- A top funnel visual (the shrinking bars) with stage counts and step rates labeled.
- A trend line of overall conversion rate over the last 8 to 12 weeks so you can see direction, not just a snapshot.
- A small segment table breaking the worst step down by device and channel.
- One plain-language callout: “Biggest leak this period: X step, Y% drop, concentrated in Z segment.”
Resist the urge to add twenty metrics. A report nobody reads changes nothing. The version that gets actually used in a Monday standup is almost always the one that fits on a single screen.
Step 7: Set a review cadence and close the loop
A funnel report only creates value when it drives action. Pick a cadence, weekly for active stores or monthly for slower-moving catalogs, and in each review do exactly one thing: identify the single biggest leak, form a hypothesis about the cause, and ship one change to test it. Then watch the next report to see if the step rate moved. This tight loop (measure, hypothesize, change, re-measure) is what turns a dashboard into compounding revenue growth. For the broader set of numbers worth watching alongside the funnel, see our guide on ecommerce analytics metrics that matter.
Common mistakes that make funnel reports lie
- Counting purchases from the browser tag. Use settled orders from your platform or processor as truth.
- Unstitched stages. If the steps aren’t joined on one identity key, the “subset” relationship is fiction.
- Ignoring consent and ad-blocker loss. Top-of-funnel counts are systematically under-reported; know your blind spot.
- Blending segments. The average funnel rarely reflects any real user’s experience.
- Chasing the headline rate. Optimize step rates and absolute drop-off, not the vanity number.
- Confusing micro-conversions with revenue. A higher add-to-cart rate that doesn’t lift purchases is motion, not progress.
If you want a tightly integrated funnel out of the box, where storefront, cart, checkout, and order data already share one identity layer, that’s the kind of thing a unified platform like Wcart is built to give you, instead of stitching five tools together by hand.
Frequently asked questions
What is a good ecommerce conversion rate?
There is no single universal number. Conversion rate varies widely by industry, price point, traffic source, and whether you measure sessions or unique users. Rather than chasing an external benchmark, track your own stage-to-stage rates over time and aim to improve the specific step where you lose the most revenue.
How many stages should my funnel have?
Start with five, sessions, product views, add-to-cart, checkout started, and purchase. Only add stages you can measure reliably and that would change a decision, such as “search performed” for search-heavy stores or “vendor storefront viewed” for marketplaces. Extra stages you can’t instrument cleanly just add noise.
Should I use Google Analytics or my store database for the funnel?
Use both. Analytics is best for top-of-funnel browsing events like sessions and product views, while your order or payment system is the source of truth for checkout starts and completed purchases. Never count final purchases from a client-side analytics tag, because ad-blockers and consent banners cause it to undercount.
Why does my analytics conversion rate differ from my actual orders?
Client-side tracking commonly under-reports purchases due to ad-blockers, cookie consent choices, page navigation firing before the tag, and sampling. Your true order count comes from your backend or payment processor. Expect a gap and reconcile the two rather than trusting the browser-side number for revenue decisions.
How do I find where customers drop off?
Calculate the step conversion rate for each stage (each stage divided by the one before it) and the absolute number of people lost at each step. The biggest percentage drop and the biggest absolute loss tell you where to focus. Then segment that step by device and traffic source to localize the cause.
How often should I review the funnel report?
Weekly for active, high-traffic stores and monthly for slower-moving catalogs. The cadence matters less than the discipline: each review, identify the single biggest leak, ship one change to address it, and check the next report to confirm the step rate moved.
What’s the difference between micro-conversions and the main conversion?
Micro-conversions are intermediate actions like add-to-cart or newsletter signup, while the main conversion is a completed, paid purchase. Micro-conversions are useful diagnostics, but improving one only matters if it ultimately lifts paid orders. Always verify that a micro-conversion gain flows through to revenue.

























Leave a Reply