
Quick answer:
Customer lifetime value (LTV) is simply how much profit a customer brings you over the whole time they shop with you, not just their first order. It’s what shifts your focus from chasing one-time sales to building real repeat business. The number only matters when you compare it to what it cost you to win that customer in the first place if you’re spending more to acquire someone than they’re worth to you long-term, something’s broken
Wcart provides a no-code ecommerce platform built for businesses that want to launch fast and grow without hitting a wall later. It handles hosting, payment integration, and store building in one place,
Key Takeaways:
- A ratio above 5:1 often signals under-investment in growth, not outstanding efficiency it can mean a business is leaving profitable acquisition spend on the table (Source: Geckoboard)
- Ratios below 3:1 are common and acceptable for DTC ecommerce brands specifically, with 2026 benchmarks putting DTC ecommerce at 1.5:1 to 3:1 and DTC subscription brands closer to 4.1:1, compared to a 3.2:1 median for B2B SaaS (Source: Foundry CRO)
- CAC payback period matters as much as the ratio itself a 4:1 LTV:CAC ratio with a 36-month payback is a fundamentally different, riskier business than the same ratio with a 12-month payback (Source: ORM)
- Using revenue instead of gross-margin-adjusted profit overstates LTV by 1.5–3x, which is the single most common calculation error and the reason many “healthy” ratios don’t hold up under scrutiny (Source: Stackmatix)
- Customer acquisition costs have roughly tripled across ecommerce since 2015, rising from an average of $24–$28 to $78–$82 by 2025, which is a major reason LTV discipline matters more now than it used to (Source: Eightx)
Most ecommerce founders obsess over the first sale. The operators who build durable, profitable stores obsess over the second, fifth, and twentieth. Customer lifetime value is the metric that forces that shift in thinking. This guide shows you how to calculate it, where the common formulas break, and the concrete levers that move it. It’s written for people who run real catalogs, not spreadsheets in a vacuum.
What is Customer Lifetime Value(LTV)?
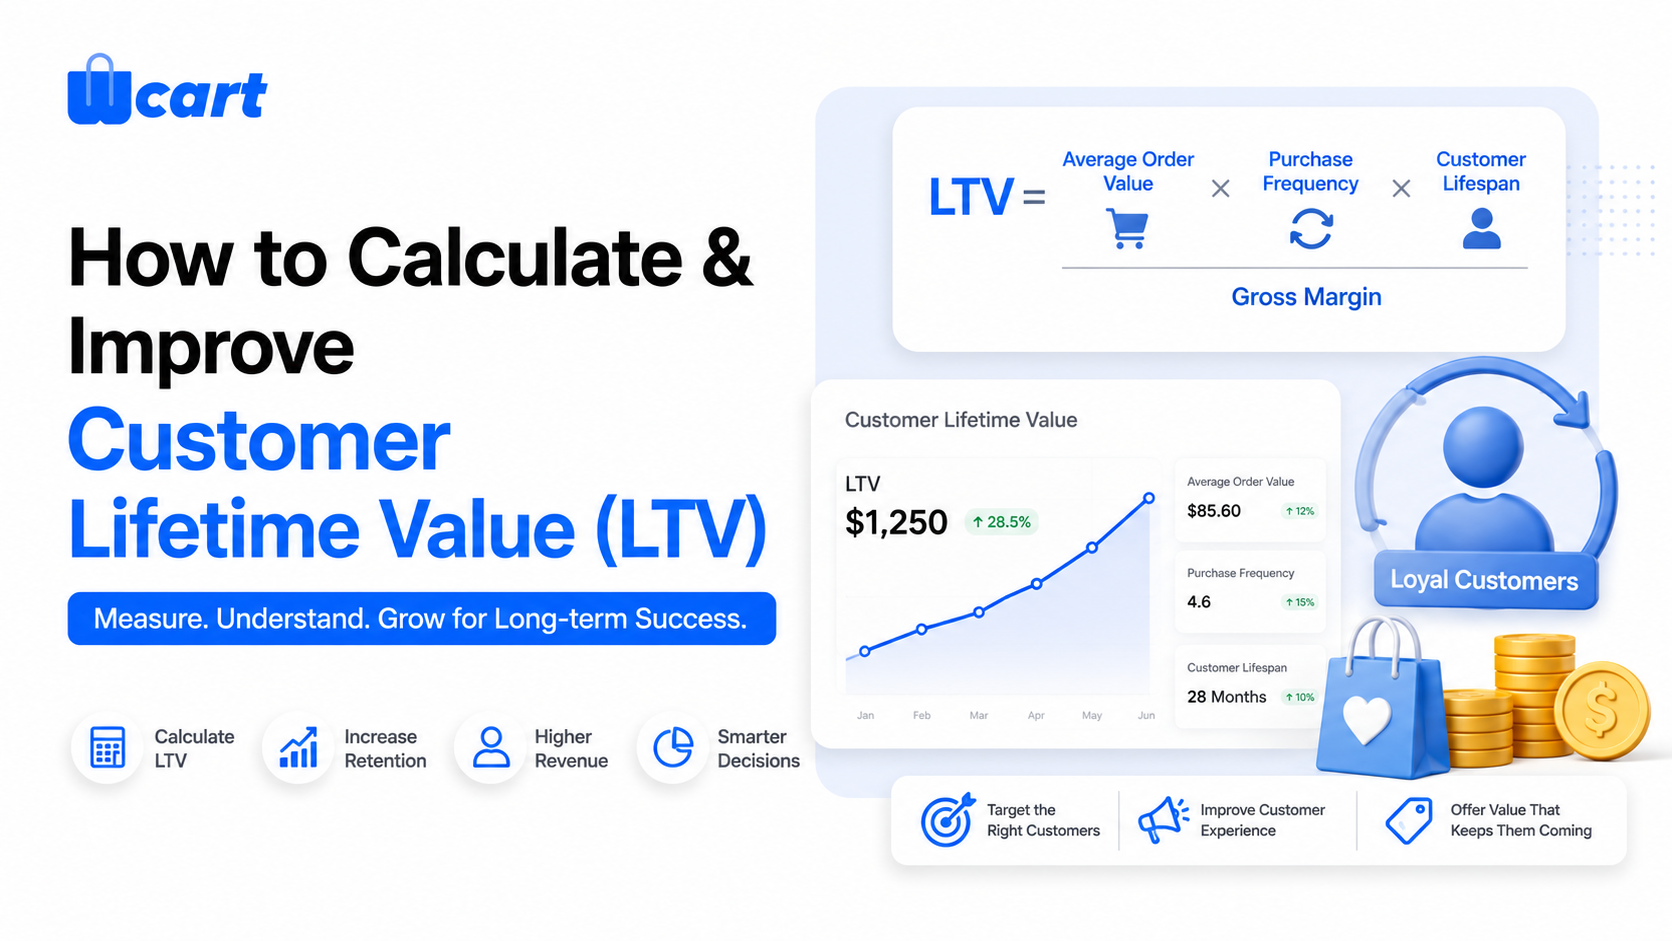
Customer lifetime value (LTV or CLV) is the total gross profit a customer generates across their entire relationship with your store. The simplest reliable formula is LTV = Average Order Value × Purchase Frequency × Customer Lifespan × Gross Margin. For a faster monthly view, use LTV = (ARPU × Gross Margin) ÷ Churn Rate.
You improve LTV by raising order value, getting people to buy again more often, extending the relationship through retention, and protecting margin. Acquiring more customers is not on that list. And the rule that matters most: always compare LTV to customer acquisition cost (CAC), and aim for an LTV:CAC ratio of roughly 3:1 or better.
What customer lifetime value actually means
Customer lifetime value is the net profit you expect from a customer over the full duration of their relationship with your business. Two words trip people up. First, profit, not revenue. Second, expect, meaning it is partly a forecast. A customer who spends $500 with you at a 20% gross margin is worth $100 in contribution, not $500. Treating revenue as value is the most common mistake we see, and it quietly inflates every downstream decision.
There are two flavors you will run into:
- Historic LTV. The actual profit a customer has generated to date. Easy to compute from order history, but backward-looking.
- Predictive LTV. A forecast of total value including future purchases. Harder, but it is what you need for acquisition budgeting and cohort decisions.
For most stores under a few million in revenue, a well-built historic LTV with a sensible lifespan assumption is plenty to drive better decisions. You do not need a machine-learning model to start.
How to calculate customer lifetime value for ecommerce
Start with the components. You need four inputs, all of which a competent ecommerce platform can export from order data.
Step 1 – Average Order Value (AOV)
- AOV = Total Revenue ÷ Number of Orders, over a fixed window. We recommend a trailing 12 months to smooth seasonality. If your store has wildly different segments, say wholesale and retail in a marketplace, calculate AOV per segment rather than blended.
Step 2 – Purchase Frequency
- Purchase Frequency = Number of Orders ÷ Number of Unique Customers, over the same window. A frequency of 1.4 means the average customer ordered 1.4 times that year. This number is brutally honest about whether you have a repeat business or a series of one-night stands.
Step 3 – Customer Lifespan
- This is the squishy one. If you have years of data, derive it from observed retention. If you do not, a practical proxy is Lifespan ≈ 1 ÷ Churn Rate. A 50% annual churn implies a roughly 2-year average lifespan. Be honest here. Optimistic lifespan assumptions are how LTV models lie to you.
Step 4 – Gross Margin
- Use contribution margin if you can: revenue minus COGS, payment fees, fulfillment, and returns. A 40% headline margin can become 25% after shipping and a 12% return rate. Returns are especially punishing in apparel and footwear.
Putting it together
| Method | Formula | Best for |
|---|---|---|
| Traditional | AOV × Frequency × Lifespan × Margin | Stores with 12+ months of order history |
| Churn-based | (ARPU × Margin) ÷ Churn Rate | Subscription or replenishment models |
| Cohort / predictive | Modeled from retention curves per signup cohort | Scaling stores optimizing acquisition spend |
Worked example. Say AOV is $60, purchase frequency is 2.0 per year, average lifespan is 3 years, and contribution margin is 35%. LTV = 60 × 2.0 × 3 × 0.35 = $126. That single number tells you the absolute ceiling you can afford to pay to acquire a customer profitably, and most stores set their ad budgets without ever computing it.
The metric that gives LTV meaning: LTV:CAC
LTV in isolation is trivia. LTV compared to customer acquisition cost is strategy. CAC is total sales and marketing spend divided by new customers acquired in the same period. The ratio tells you whether your growth engine is creating or destroying value.
| LTV:CAC ratio | What it usually signals |
|---|---|
| Below 1:1 | You lose money on every customer. Stop and fix unit economics. |
| Around 1:1 to 2:1 | Thin. Margin or retention problem; growth is fragile. |
| Roughly 3:1 | Commonly cited healthy zone sustainable, room to reinvest. |
| 5:1 or higher | Often a sign of under-investing in acquisition, not winning. |
The 3:1 figure is a widely repeated rule of thumb, not a law of physics. It originated in SaaS, and your ideal ratio depends on margin, payback period, and how much working capital you can tie up. A very high ratio frequently means you are leaving growth on the table because you are too conservative with acquisition spend.
The companion metric to watch is CAC payback period: how many months of margin it takes to recover acquisition cost. Under 12 months is comfortable for most ecommerce. The thing nobody mentions is that payback period, not the ratio, is what bites you in practice. A 4:1 LTV with an 18-month payback can still starve you of cash long before that lifetime value ever shows up in the bank.
How to improve customer lifetime value
Look back at the formula. There are exactly four mathematical levers, and every tactic ladders up to one of them. Work them in roughly this order, because retention compounds.
Lever 1-Increase purchase frequency (usually the biggest win)
Getting an existing customer to buy again is far cheaper than acquiring a new one. Concrete moves: a genuinely useful post-purchase email flow, replenishment reminders timed to consumption cycles, a lightweight loyalty or points program, and curated re-engagement based on browse and purchase history. For replenishable goods, a subscribe-and-save option can turn a once-a-quarter buyer into a locked-in monthly one.
Lever 2 – Raise average order value
Relevant cross-sells at the cart, tiered free-shipping thresholds set just above current AOV, and honest product bundles all work. The key word is relevant. Aggressive upsells that feel like pressure erode trust and increase returns, which quietly destroys margin.
Lever 3 – Extend customer lifespan (reduce churn)
Lifespan is won on operational basics: fast, accurate fulfillment, frictionless returns, responsive support, and a checkout that does not fight the customer. A first order that ships late and arrives damaged is a churned customer regardless of your marketing.
Measure repeat-purchase rate by cohort and watch where the curve flattens. What actually happens in most stores is that the second-purchase rate is the whole ballgame: once someone buys twice, they tend to keep coming back, so every retention dollar is best aimed at that first-to-second jump.
Lever 4 – Protect and grow margin
LTV is profit-based, so a return-rate reduction or a renegotiated payment fee flows straight to value. Better sizing guidance, clearer product photography, and accurate descriptions cut returns. Steering customers toward lower-fee payment methods or annual plans improves contribution per order.
Segment, then act
Blended LTV hides your best customers. Calculate LTV by acquisition channel, by first product purchased, and by discount-versus-full-price acquisition. You will almost always find that customers acquired on deep discount have dramatically lower lifespans than full-price buyers, which should change where you spend.
RFM (recency, frequency, monetary) segmentation is a simple, durable way to act on this without a data-science team. The RFM model has been used in direct marketing for decades and translates cleanly to ecommerce.
Common mistakes that wreck LTV calculations
- Using revenue instead of margin. The most frequent and most expensive error.
- Ignoring returns and refunds. Especially in fashion, returns can halve effective LTV.
- Optimistic lifespan assumptions. If you cannot observe it, derive it from churn and stay conservative.
- Blending dissimilar segments. A whale and a one-time discount buyer averaged together produce a number that describes neither.
- Computing LTV but never comparing to CAC. The number is only actionable in ratio form.
For the underlying analytics discipline (clean event tracking, consistent attribution windows, and trustworthy order data) Google’s guidance on measurement is a solid grounding; see the Google Analytics Help Center.
How a platform should support LTV work
Calculating LTV is only sustainable if your store exports clean customer-level order history, margin inputs, and cohort data without manual stitching. On Wcart, the data model is built around customers and orders as first-class entities, which makes cohort and segment-level LTV reporting practical for both single-brand stores and multi-vendor marketplaces. If you are choosing or building a platform, treat exportable, customer-keyed order data as a non-negotiable requirement. You cannot improve what you cannot measure cleanly.
Frequently asked questions
What is a good customer lifetime value?
There is no universal good number; LTV is only meaningful relative to your customer acquisition cost. A healthy LTV:CAC ratio is commonly cited as around 3:1, meaning a customer is worth roughly three times what it costs to acquire them. Judge LTV against CAC and your margin, never as an absolute.
What is the difference between LTV and CLV?
None. LTV (lifetime value) and CLV (customer lifetime value) are the same metric, used interchangeably. Some teams use CLV for the per-customer figure and LTV more loosely, but they refer to the same concept: total profit over the customer relationship.
How often should I recalculate LTV?
Recalculate quarterly for strategic decisions and monthly if you are actively optimizing acquisition spend. LTV shifts as retention, margin, and product mix change, so a number from a year ago can be dangerously stale for budgeting decisions.
Should LTV use revenue or profit?
Always use profit, ideally contribution margin (revenue minus COGS, payment fees, fulfillment, and returns). Revenue-based LTV systematically overstates customer value and leads to overspending on acquisition. This is the single most important correction for most stores.
How do I estimate customer lifespan without years of data?
Use the inverse of your churn rate as a proxy: lifespan is approximately 1 divided by annual churn. A 50% annual churn implies a roughly 2-year average lifespan. Stay conservative, and replace the estimate with observed cohort retention as soon as you have 12 or more months of data.
Is LTV useful for a new store with little order history?
Yes, but treat it as directional. Use early cohort data and conservative assumptions to set a maximum acceptable CAC, then refine the model as repeat-purchase data accumulates. Even a rough LTV beats setting acquisition budgets blind.
What is the fastest way to increase LTV?
For most stores, increasing repeat-purchase frequency among existing customers via post-purchase email flows and loyalty incentives gives the quickest, cheapest lift, because retaining a customer costs far less than acquiring a new one and compounds over their lifespan.

























Leave a Reply